
Human ET-1(Endothelin1) Sandwich ELISA Kit for cosmetic and personal care products research can be applied to Endocrinology and Cardiovascular biology research areas.
Overview of Human ET-1 (Endothelin1) ELISA Kit for Cometic & Personal Care Research
| Product name: | Human ET-1(Endothelin1) ELISA Kit |
| Reactivity: | Human |
| Alternative Names: | ET1; PPET1; Preproendothelin-1; Big endothelin-1; EDN1 |
| Assay Type: | Sandwich |
| Sensitivity: | 2.71 pg/mL |
| Standard: | 500 pg/mL |
| Range: | 7.82-500 pg/mL |
| Sample Type: | serum, plasma, tissue homogenates, cell lysates, cell culture supernates and other biological fluids |
| Assay Length: | 3.5h |
| Research Area: | Endocrinology;Cardiovascular biology; |
| Test principle: | The test principle applied in this kit is Sandwich enzyme immunoassay. The microtiter plate provided in this kit has been pre-coated with an antibody specific to Endothelin1(ET-1). Standards or samples are added to the appropriate microtiter plate wells then with a biotin-conjugated antibody specific to Endothelin1(ET-1). Next, Avidin conjugated to Horseradish Peroxidase (HRP) is added to each microplate well and incubated. After TMB substrate solution is added, only those wells that contain Endothelin1(ET-1), biotin-conjugated antibody and enzyme-conjugated Avidin will exhibit a change in color. The enzyme-substrate reaction is terminated by the addition of sulphuric acid solution and the color change is measured spectrophotometrically at a wavelength of 450nm ± 10nm. The concentration of Endothelin1(ET-1) in the samples is then determined by comparing the OD of the samples to the standard curve. |
[accordions]
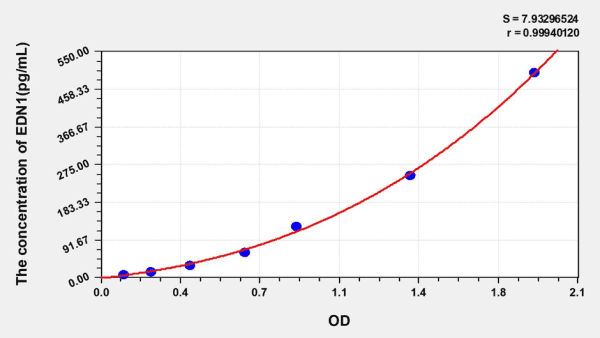
[accordion title= “Standard Curve“]
| Concentration (ng/mL) | OD | Corrected OD |
| 500.00 | 2.057 | 1.951 |
| 250.00 | 1.498 | 1.392 |
| 125.00 | 0.983 | 0.877 |
| 62.50 | 0.755 | 0.649 |
| 31.25 | 0.507 | 0.401 |
| 15.63 | 0.329 | 0.223 |
| 7.82 | 0.208 | 0.102 |
| 0.00 | 0.106 | 0.000 |
[/accordion]
[accordion title= “Precision“]
Intra-assay Precision (Precision within an assay):CV%<8% Three samples of known concentration were tested twenty times on one plate to assess intra-assay precision. Inter-assay Precision (Precision between assays):CV%<10% Three samples of known concentration were tested in forty separate assays to assess inter-assay precision. [/accordion] [accordion title= "Recovery“]
Matrices listed below were spiked with certain level of recombinant ET-1 and the recovery rates were calculated by comparing the measured value to the expected amount of ET-1 in samples.
| Matrix | Recovery range | Average |
| serum(n=5) | 86-99% | 92% |
| EDTA plasma(n=5) | 80-95% | 87% |
| Heparin plasma(n=5) | 90-105% | 97% |
[/accordion]
[accordion title=”Linearity“]
The linearity of the kit was assayed by testing samples spiked with appropriate concentration of ET-1 and their serial dilutions. The results were demonstrated by the percentage of calculated concentration to the expected.
| Matrix | 1:2 | 1:4 | 1:8 | 1:16 |
| serum(n=5) | 87-91% | 85-93% | 89-97% | 85-93% |
| EDTA plasma(n=5) | 89-97% | 85-94% | 87-96% | 85-97% |
| Heparin plasma(n=5) | 85-94% | 87-96% | 92-101% | 82-98% |
[/accordion]
Contact our Customer Care, Sales & Scientific Assistance
Consult and asked questions about our products & services
Documentation of Technical & Safety Data Sheet, Guides and more...
362 Upper Paya Lebar Rd, #07-15,
Singapore 534963
© 2015-2025 Atlantis Bioscience Pte Ltd. All rights reserved. Co Reg No: 201539516N